Beat KPIs and performance
Go to Distribution → Route & sell-out KPIs (/distribution/performance), Beat KPIs tab, and pick a date range. The table shows each rep plus a totals row.
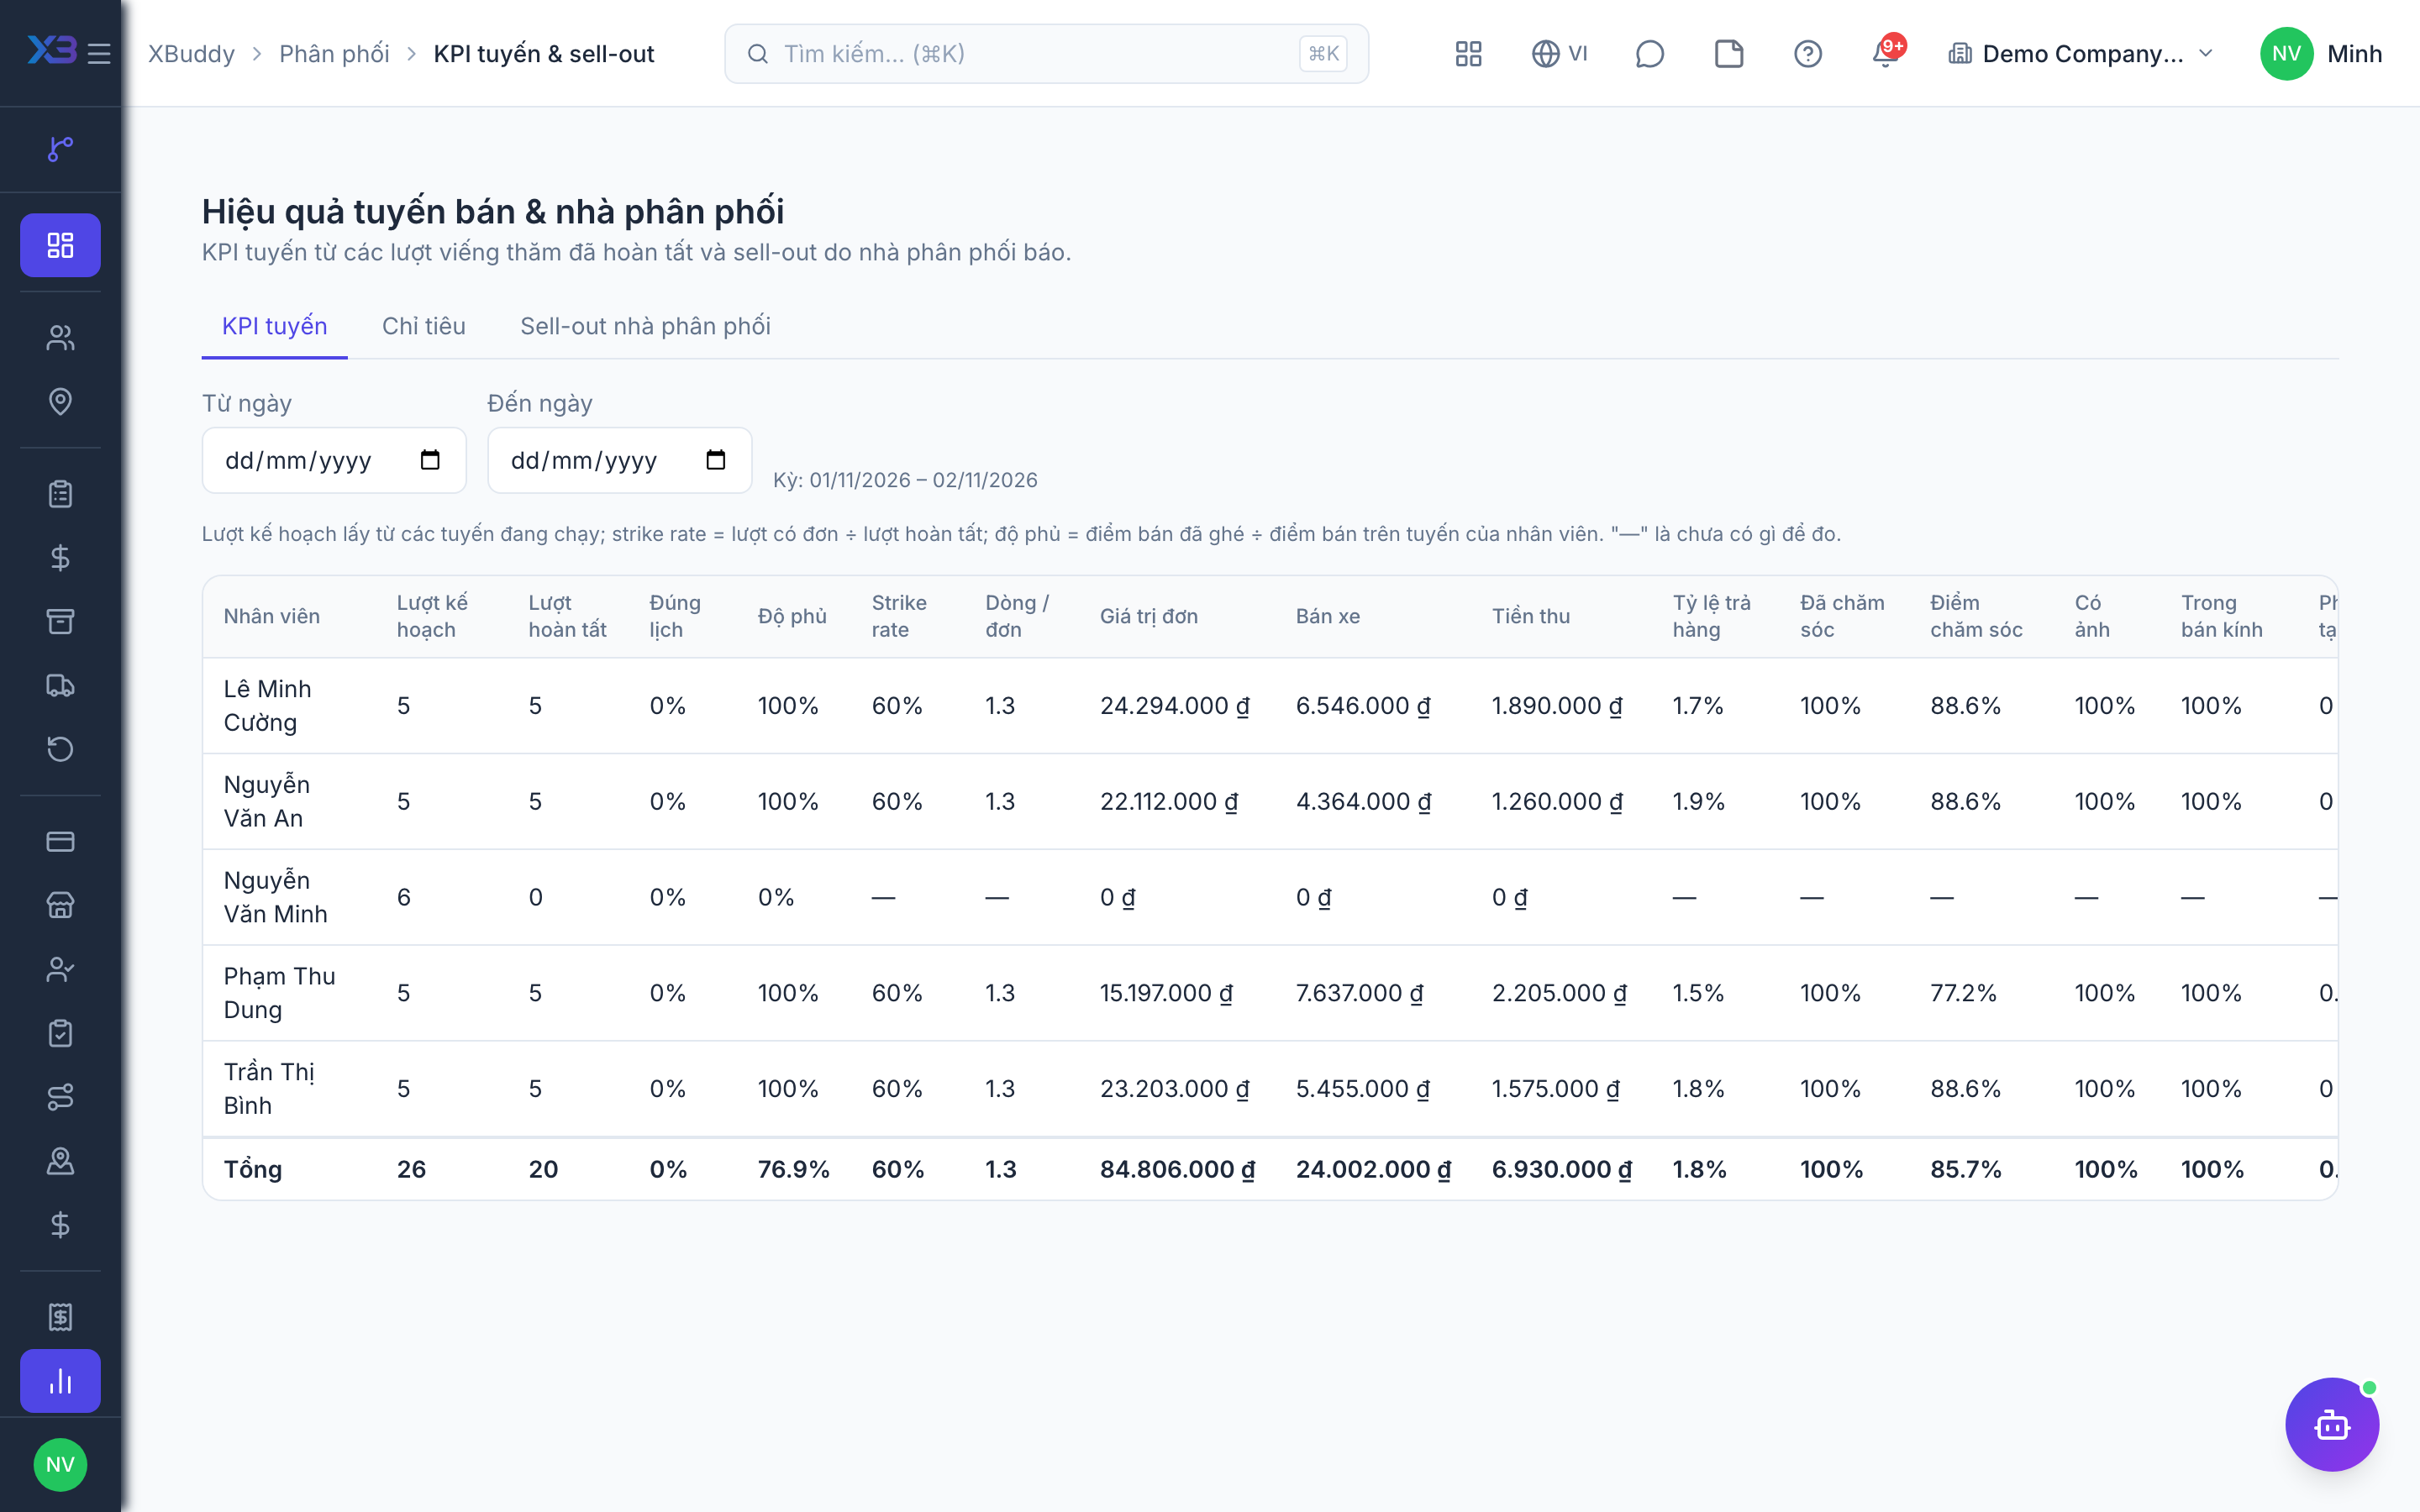
Permission: distribution:read. Regular reps only see their own figures; managers see their team.
Metrics
| Metric | How it is calculated |
|---|---|
| Planned visits | Sum of (days the beat runs × active outlets on the beat). Run days use the same rule as “today’s route”. |
| On schedule | Completed visits on the right beat, right outlet and right day, versus plan. |
| Coverage | Share of beat outlets visited. |
| Strike rate | Visits with an order ÷ completed visits. |
| Lines per order | Average number of item lines per order. |
| Order value, van sales, cash collected | Outlet order value, van-sale revenue, cash collected. |
| Return rate | Returns relative to sales. |
| Care | Care score and checklist completion. |
| Photos, in radius, minutes on site | Photo compliance, share of check-ins within the radius, time spent at the outlet. |
| New outlets | Number of newly proposed outlets. |
Tips
- KPIs are only meaningful when beats are fully planned — see Beats and route planning.
- Set targets to compare against actuals on the Targets tab — see Targets and sell-out.
- The Today board on the Overview page uses the same formulas for intraday progress.
Related
- Outlets and care · Beats and route planning · Visits and check-in · Field sales rep journey
- Ordering at the outlet · Promotions, rebates & claims · Targets and sell-out · Commissions
- Beat KPIs and performance · Overview and reports · Permissions and settings · Setup guide
- Distribution Manager AI assistant · Workflow templates · Distribution & logistics flow · XBuddy Work app