Building a custom report in Analytics Builder
When no pre-built report fits, compose your own — no SQL required.
When to use
Use the Builder when you need a cut of data that no domain page offers, for example deals by region and owner, or invoices by month. Pick a source, choose columns, filter, group, and save.
Before you start
- Running a query needs
analytics:read; saving a report needsanalytics:manage. - Each data source also needs its own domain permission (for example
analytics:payrollfor payroll data) whileanalytics.module_permission_enforcementis on (default: on). - Only sources that are wired up can be queried. An unwired source returns a 400 error instead of an empty table.
Steps
-
Go to
/analytics/builderand start a new report. -
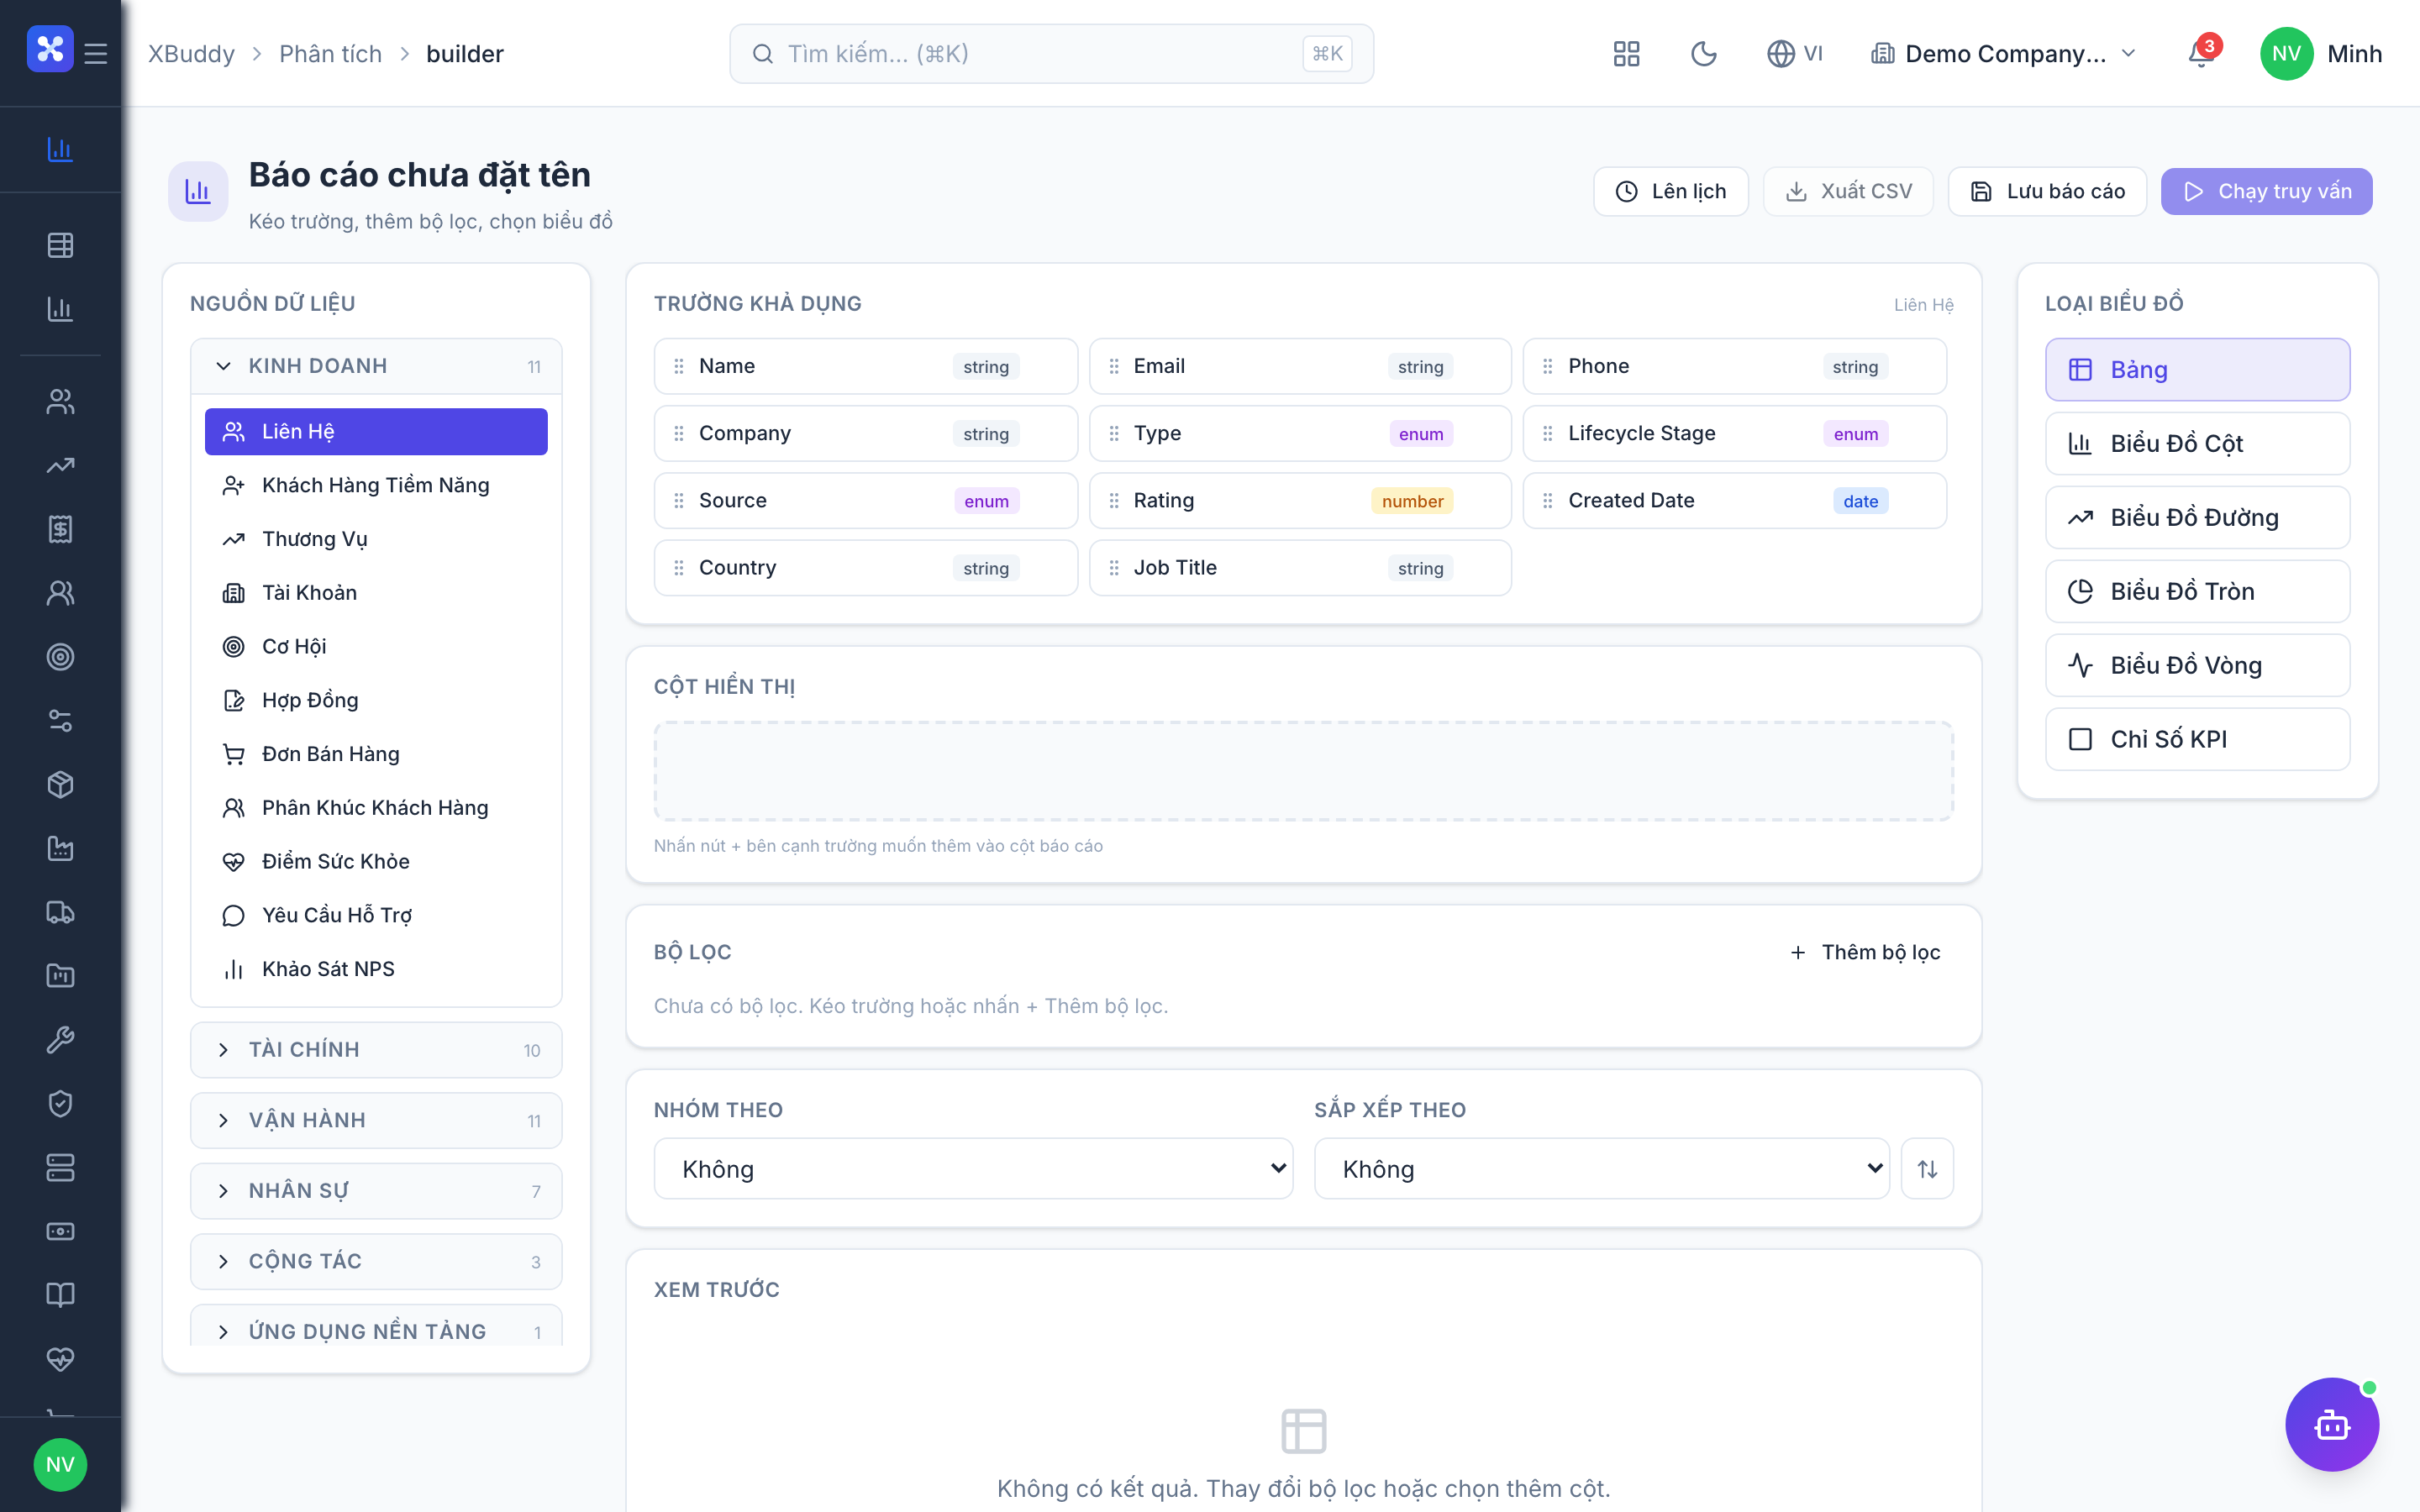
Choose a data source (for example customers, leads, deals, invoices, sales or purchase orders, journal entries, employees, inventory, projects, or tasks).
-
Pick the columns, then add grouping (dimensions) and measures (Sum, Count, Avg) to the layout.
-
Add filters, pick a visualization (table, bar, line), then Save — it now appears under
/analytics/reportsfor reuse.
Tips & common mistakes
- Start from the question (“sales by region”) and choose the source that owns those fields.
- Results follow your data scope, so a colleague with a different scope may see different totals.
- If a source returns an error, it is not yet available in the Builder; use the matching domain page instead.
- Name saved reports clearly; the library gets crowded quickly.