Running a domain report
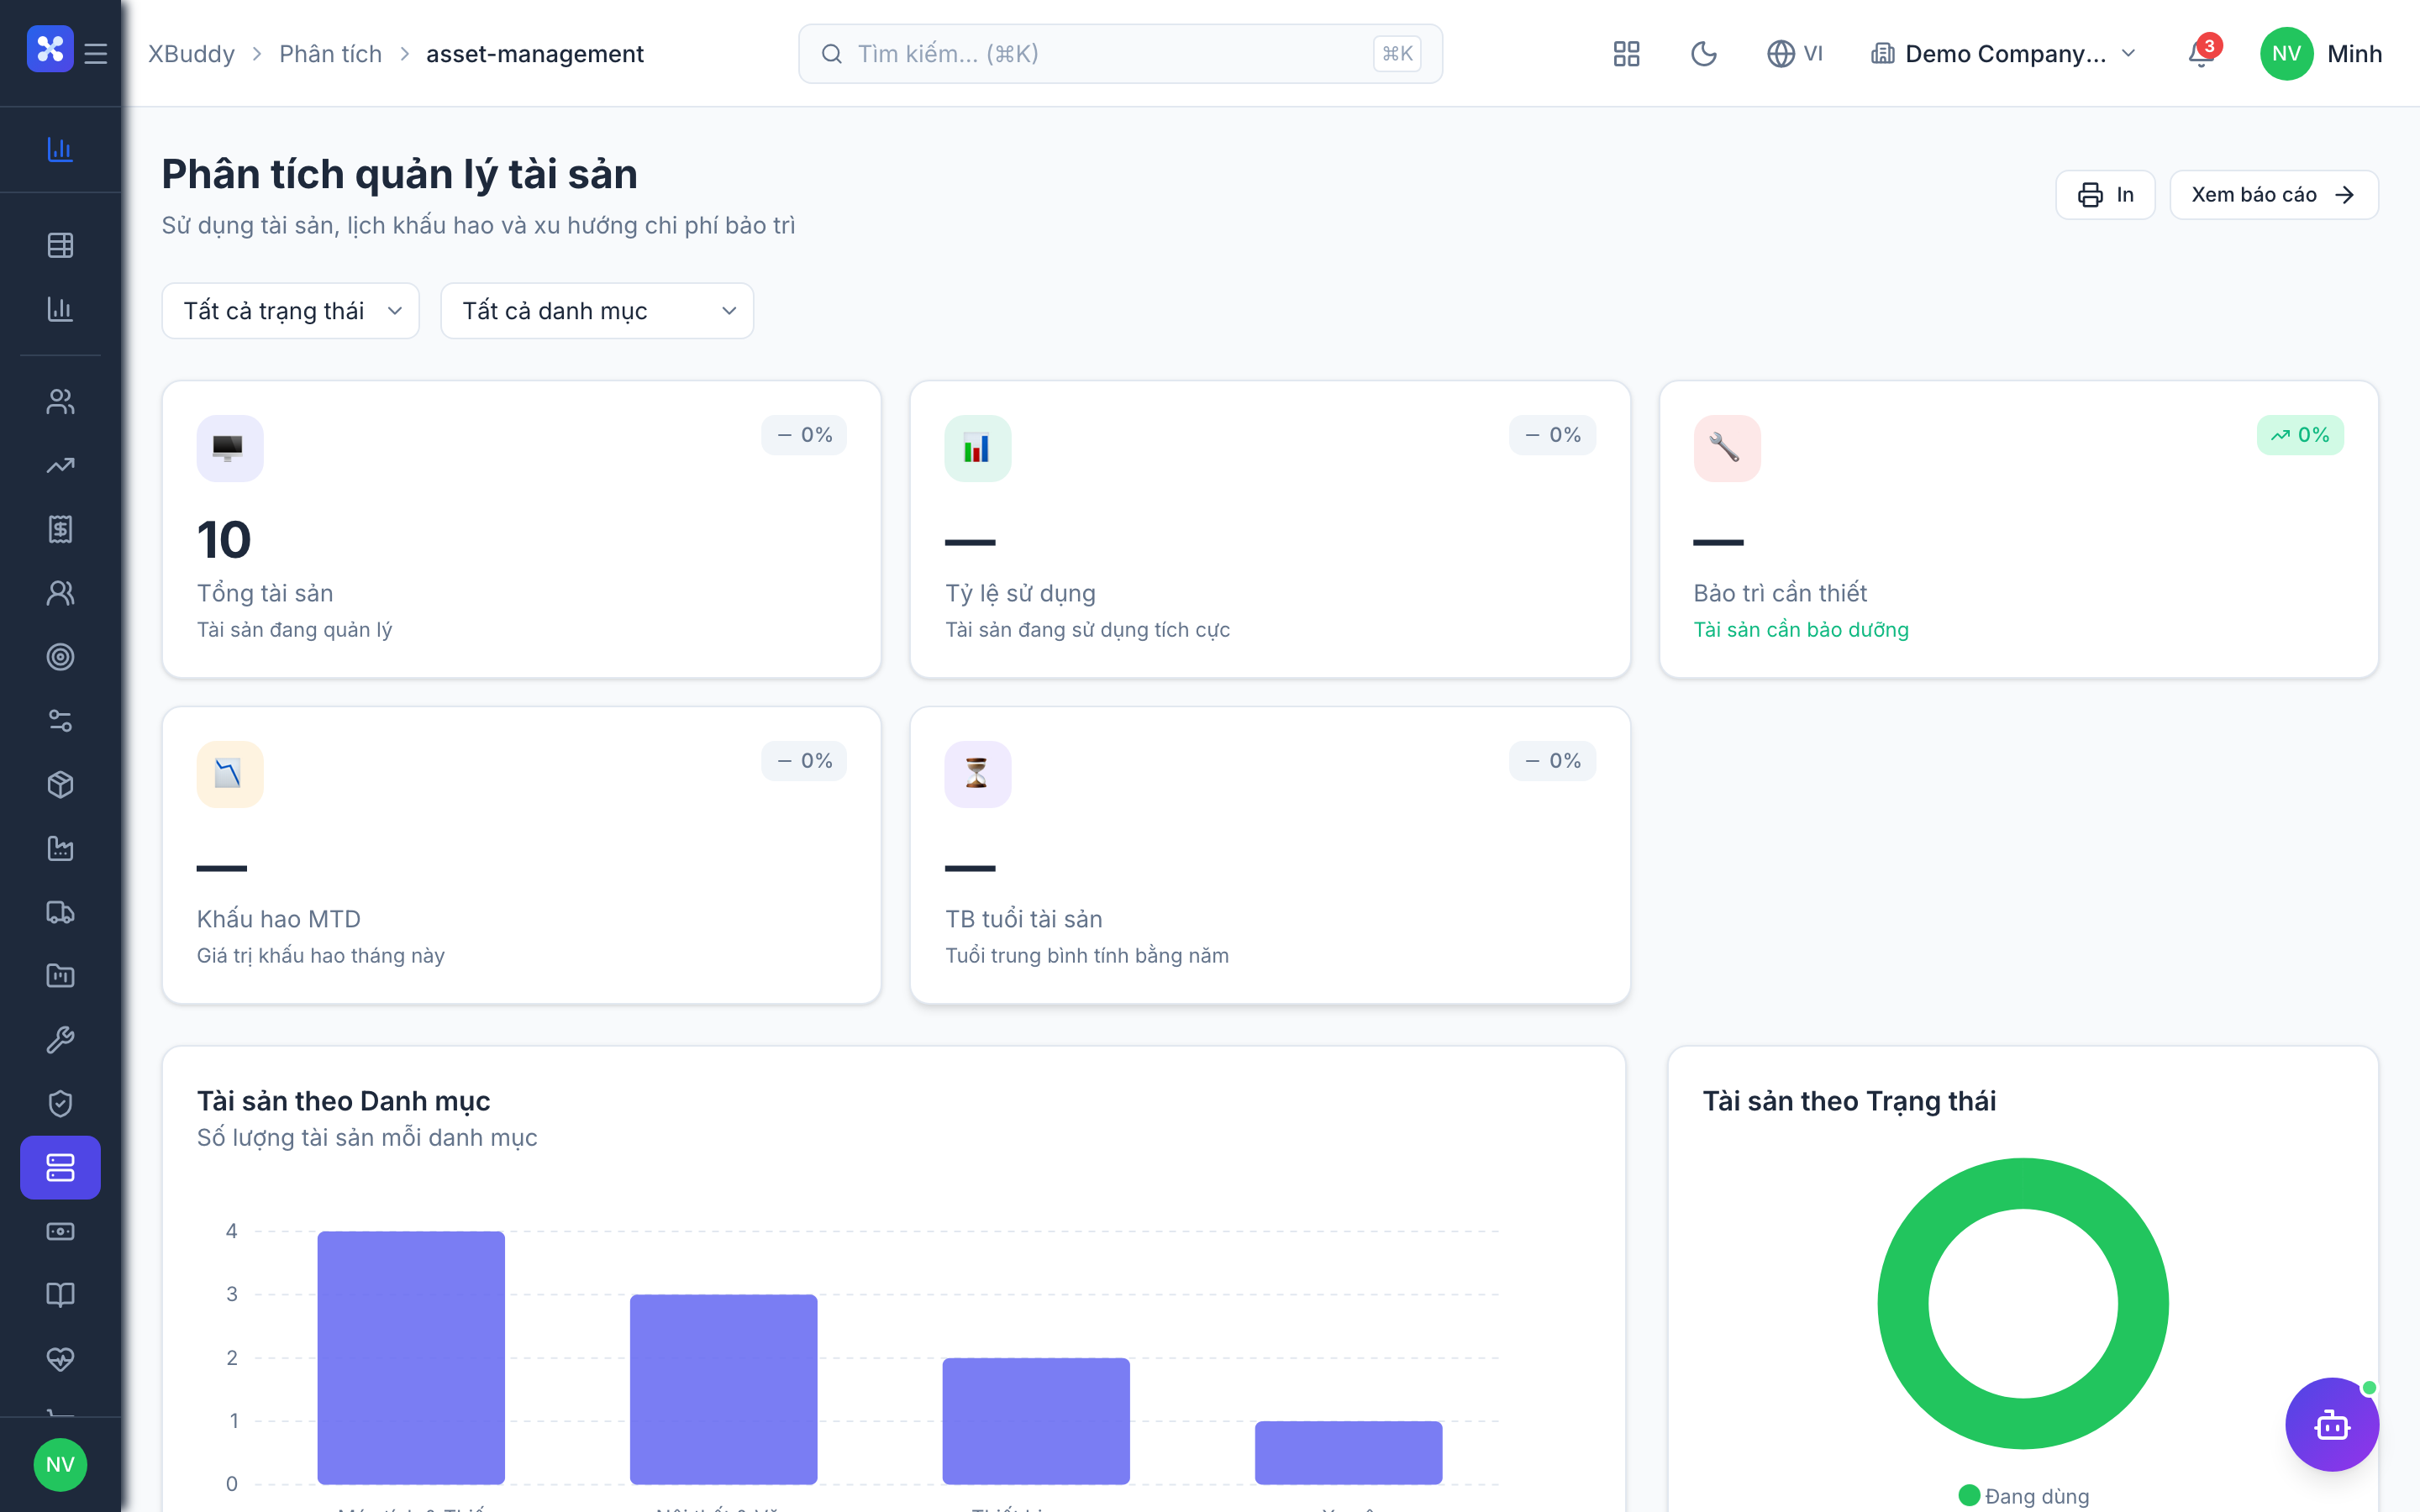
Every module ships ready-made reports; you just filter and read.
When to use
Use a domain report when you need a quick, repeatable view of one business area, such as the sales pipeline, finance, inventory, or HR. It reads directly from the source module, so the numbers match what that team sees.
Before you start
- You need
analytics:readplus the domain permission for the page, for exampleanalytics:finance,analytics:sales,analytics:crmoranalytics:hr. The Assets page usesanalytics:assets. - The page only appears when your company has the source module. A page you cannot see usually means a missing module or permission.
- While
analytics.module_permission_enforcementis on (default: on), a domain permission is required, not justanalytics:read.
Steps
-
Open
/analytics(Overview), or jump straight to a domain page such as/analytics/financeor/analytics/sales. -
Set the shared filter bar — date range, entity, and status — to scope the report.
-
Read the table (with a totals footer) and any accompanying charts; click a row to drill into the source record.
-
Click Export CSV to download the exact filtered view.
Tips & common mistakes
- Remember data scope: someone on “own” or “team” scope sees fewer rows than someone on “all”.
- Do not confuse
/reports(the library of business reports) with/analytics/reports(your saved Builder reports). - Set the date range first; most “wrong total” questions come from a forgotten filter.
- If a number looks off, drill into a row to check the source record before exporting.