Analytics
Analytics is XBuddy’s reporting suite. It centralizes every module’s reports into one hub, adds a drag-and-drop Analytics Builder for custom reports, and lets you export to CSV or schedule automated delivery to stakeholders. Where the Dashboard gives a live at-a-glance view, Analytics is where you sit down to analyze, slice, and distribute the numbers.
It is used by analysts, finance and ops leads, and any manager who needs repeatable, filterable, exportable reporting across domains.
Key Features
- A single Reports Hub cataloging every report across all modules
- Pre-built domain report pages for 20+ business areas
- Analytics Builder — build custom reports without SQL (pick source, dimensions, measures, filters)
- Consistent filter bar (date range, entity, status) shared across report pages
- One-click CSV export with totals footer on listing reports
- Scheduled delivery — email a report on a recurring cadence
- AI Usage tracking for AI/agent token consumption and cost
- Drill-through from report rows into the underlying source records
Important features
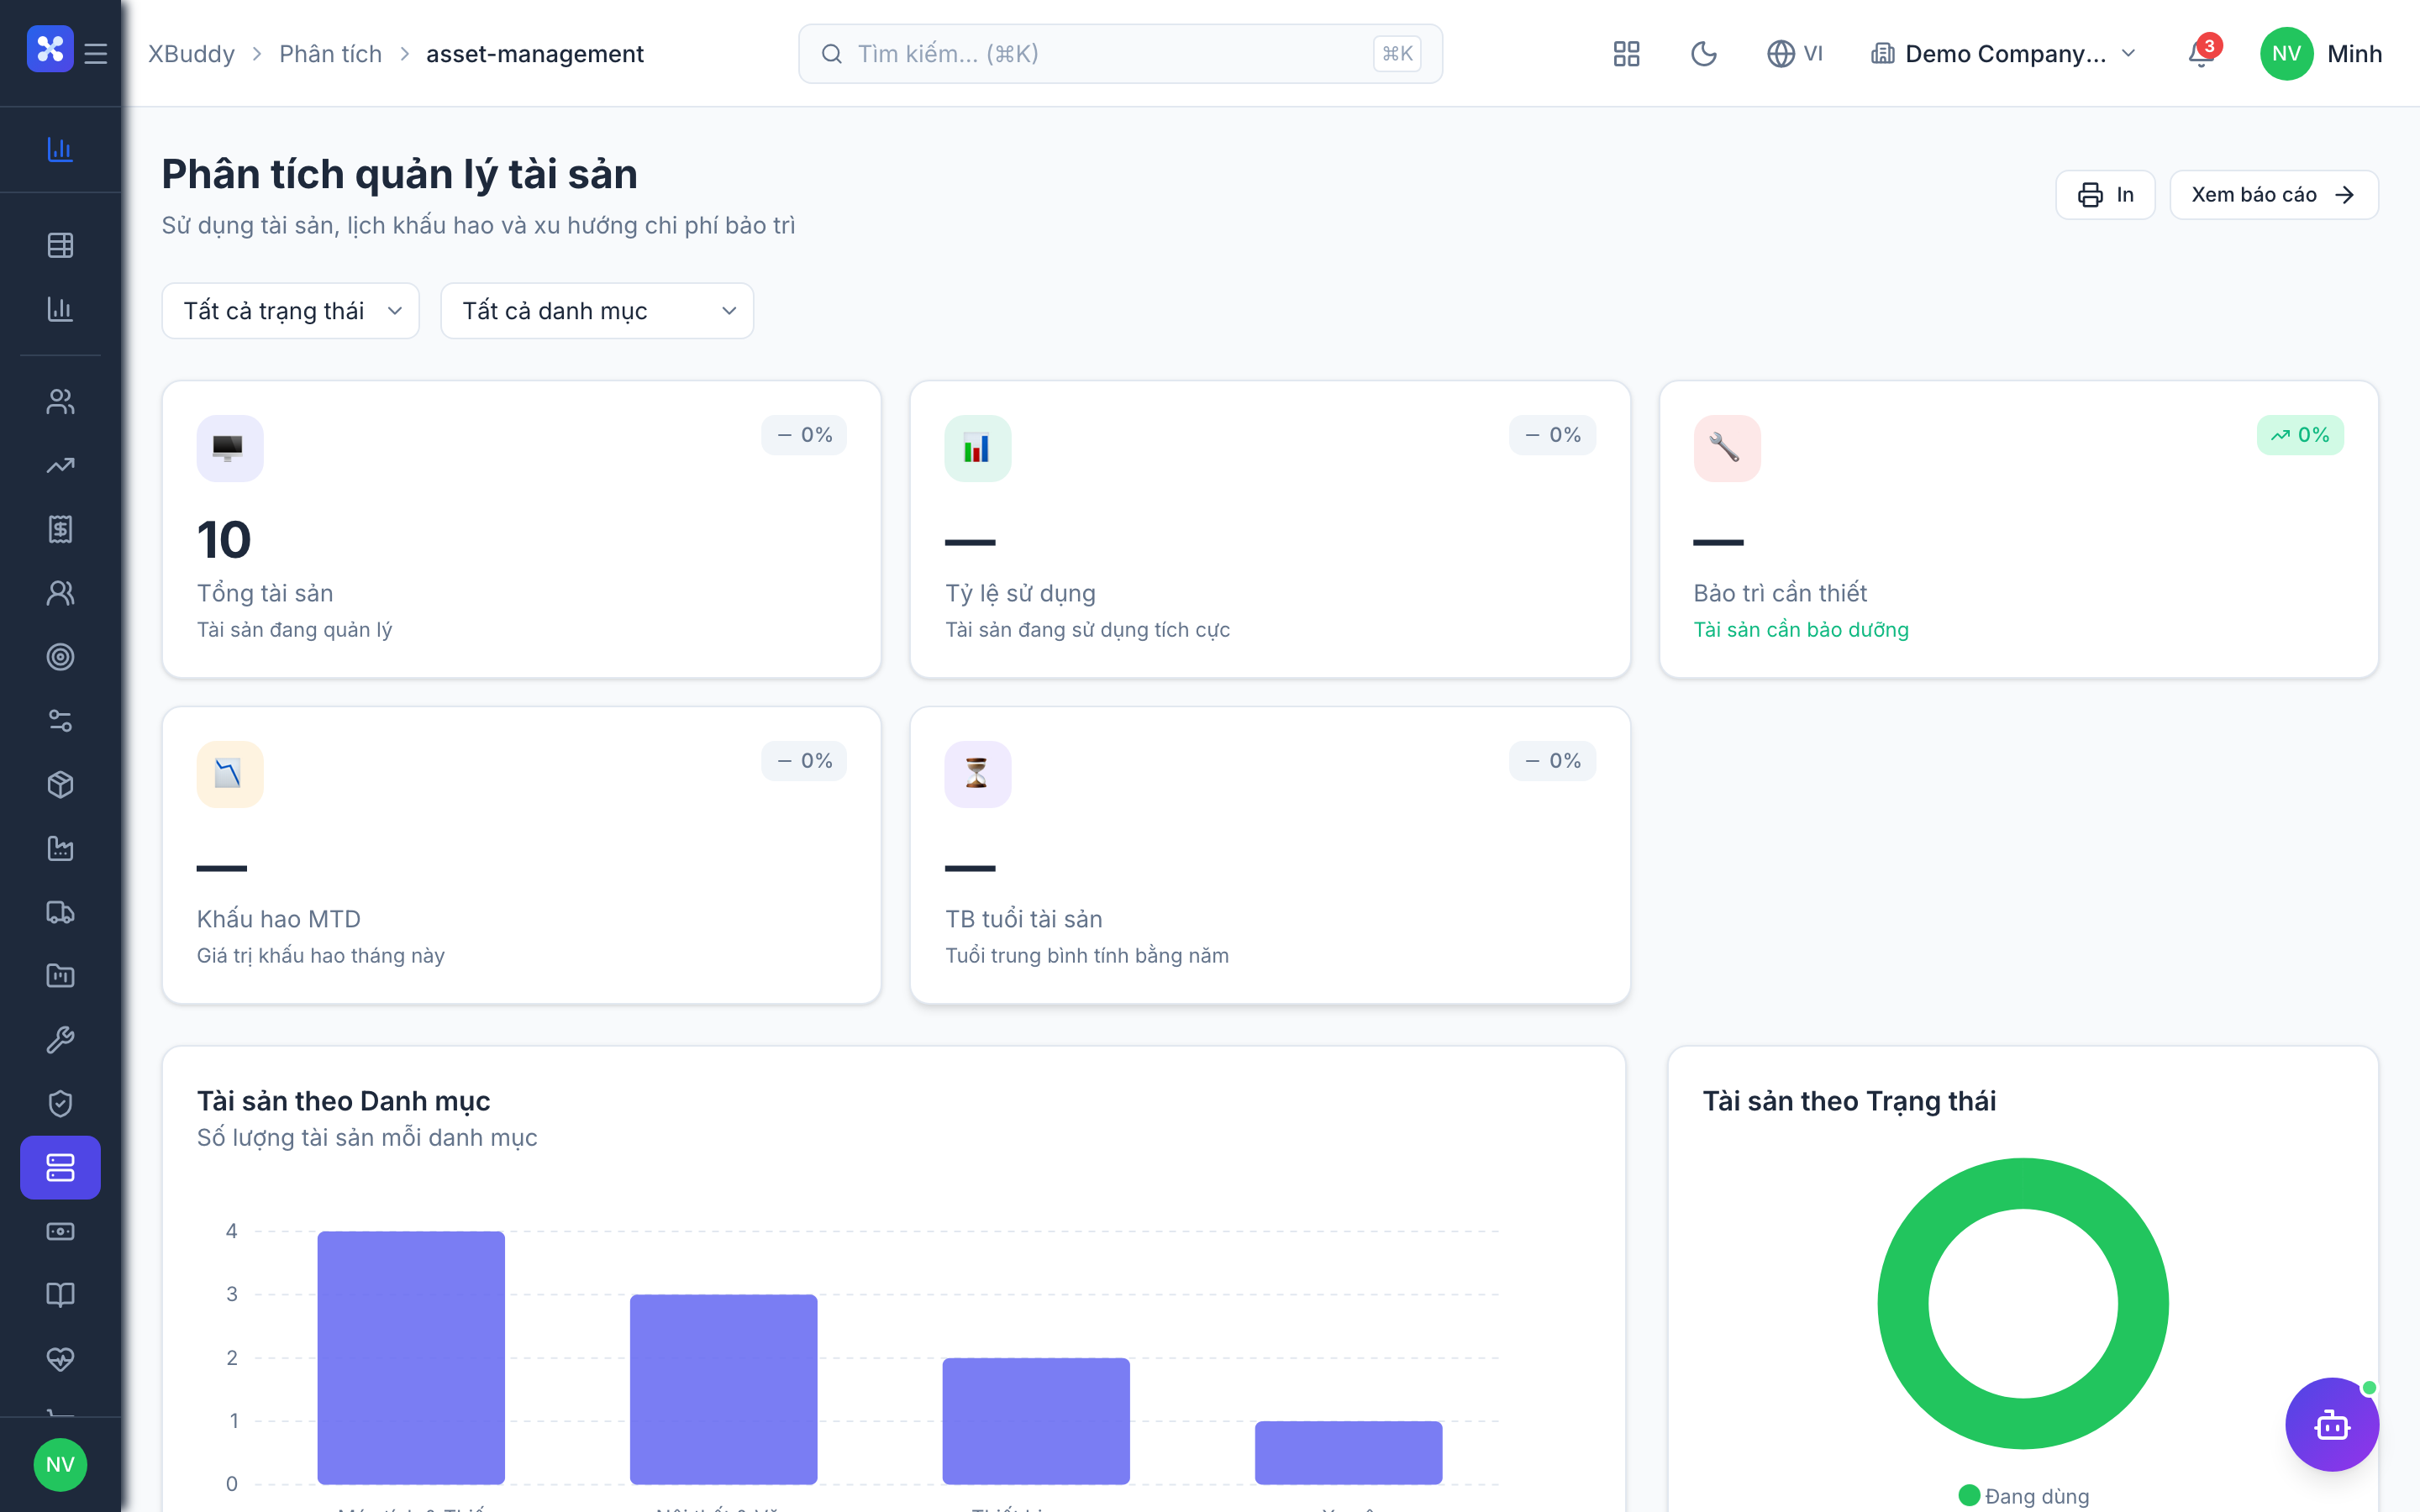
Running a domain report
Every module ships ready-made reports; you just filter and read.
-
Open /analytics → Reports Hub, or jump straight to a domain page such as /analytics/finance or /analytics/sales.
-
Set the shared filter bar — date range, entity, and status — to scope the report.
-
Read the table (with a totals footer) and any accompanying charts; click a row to drill into the source record.
-
Click Export CSV to download the exact filtered view.
Building a custom report in Analytics Builder
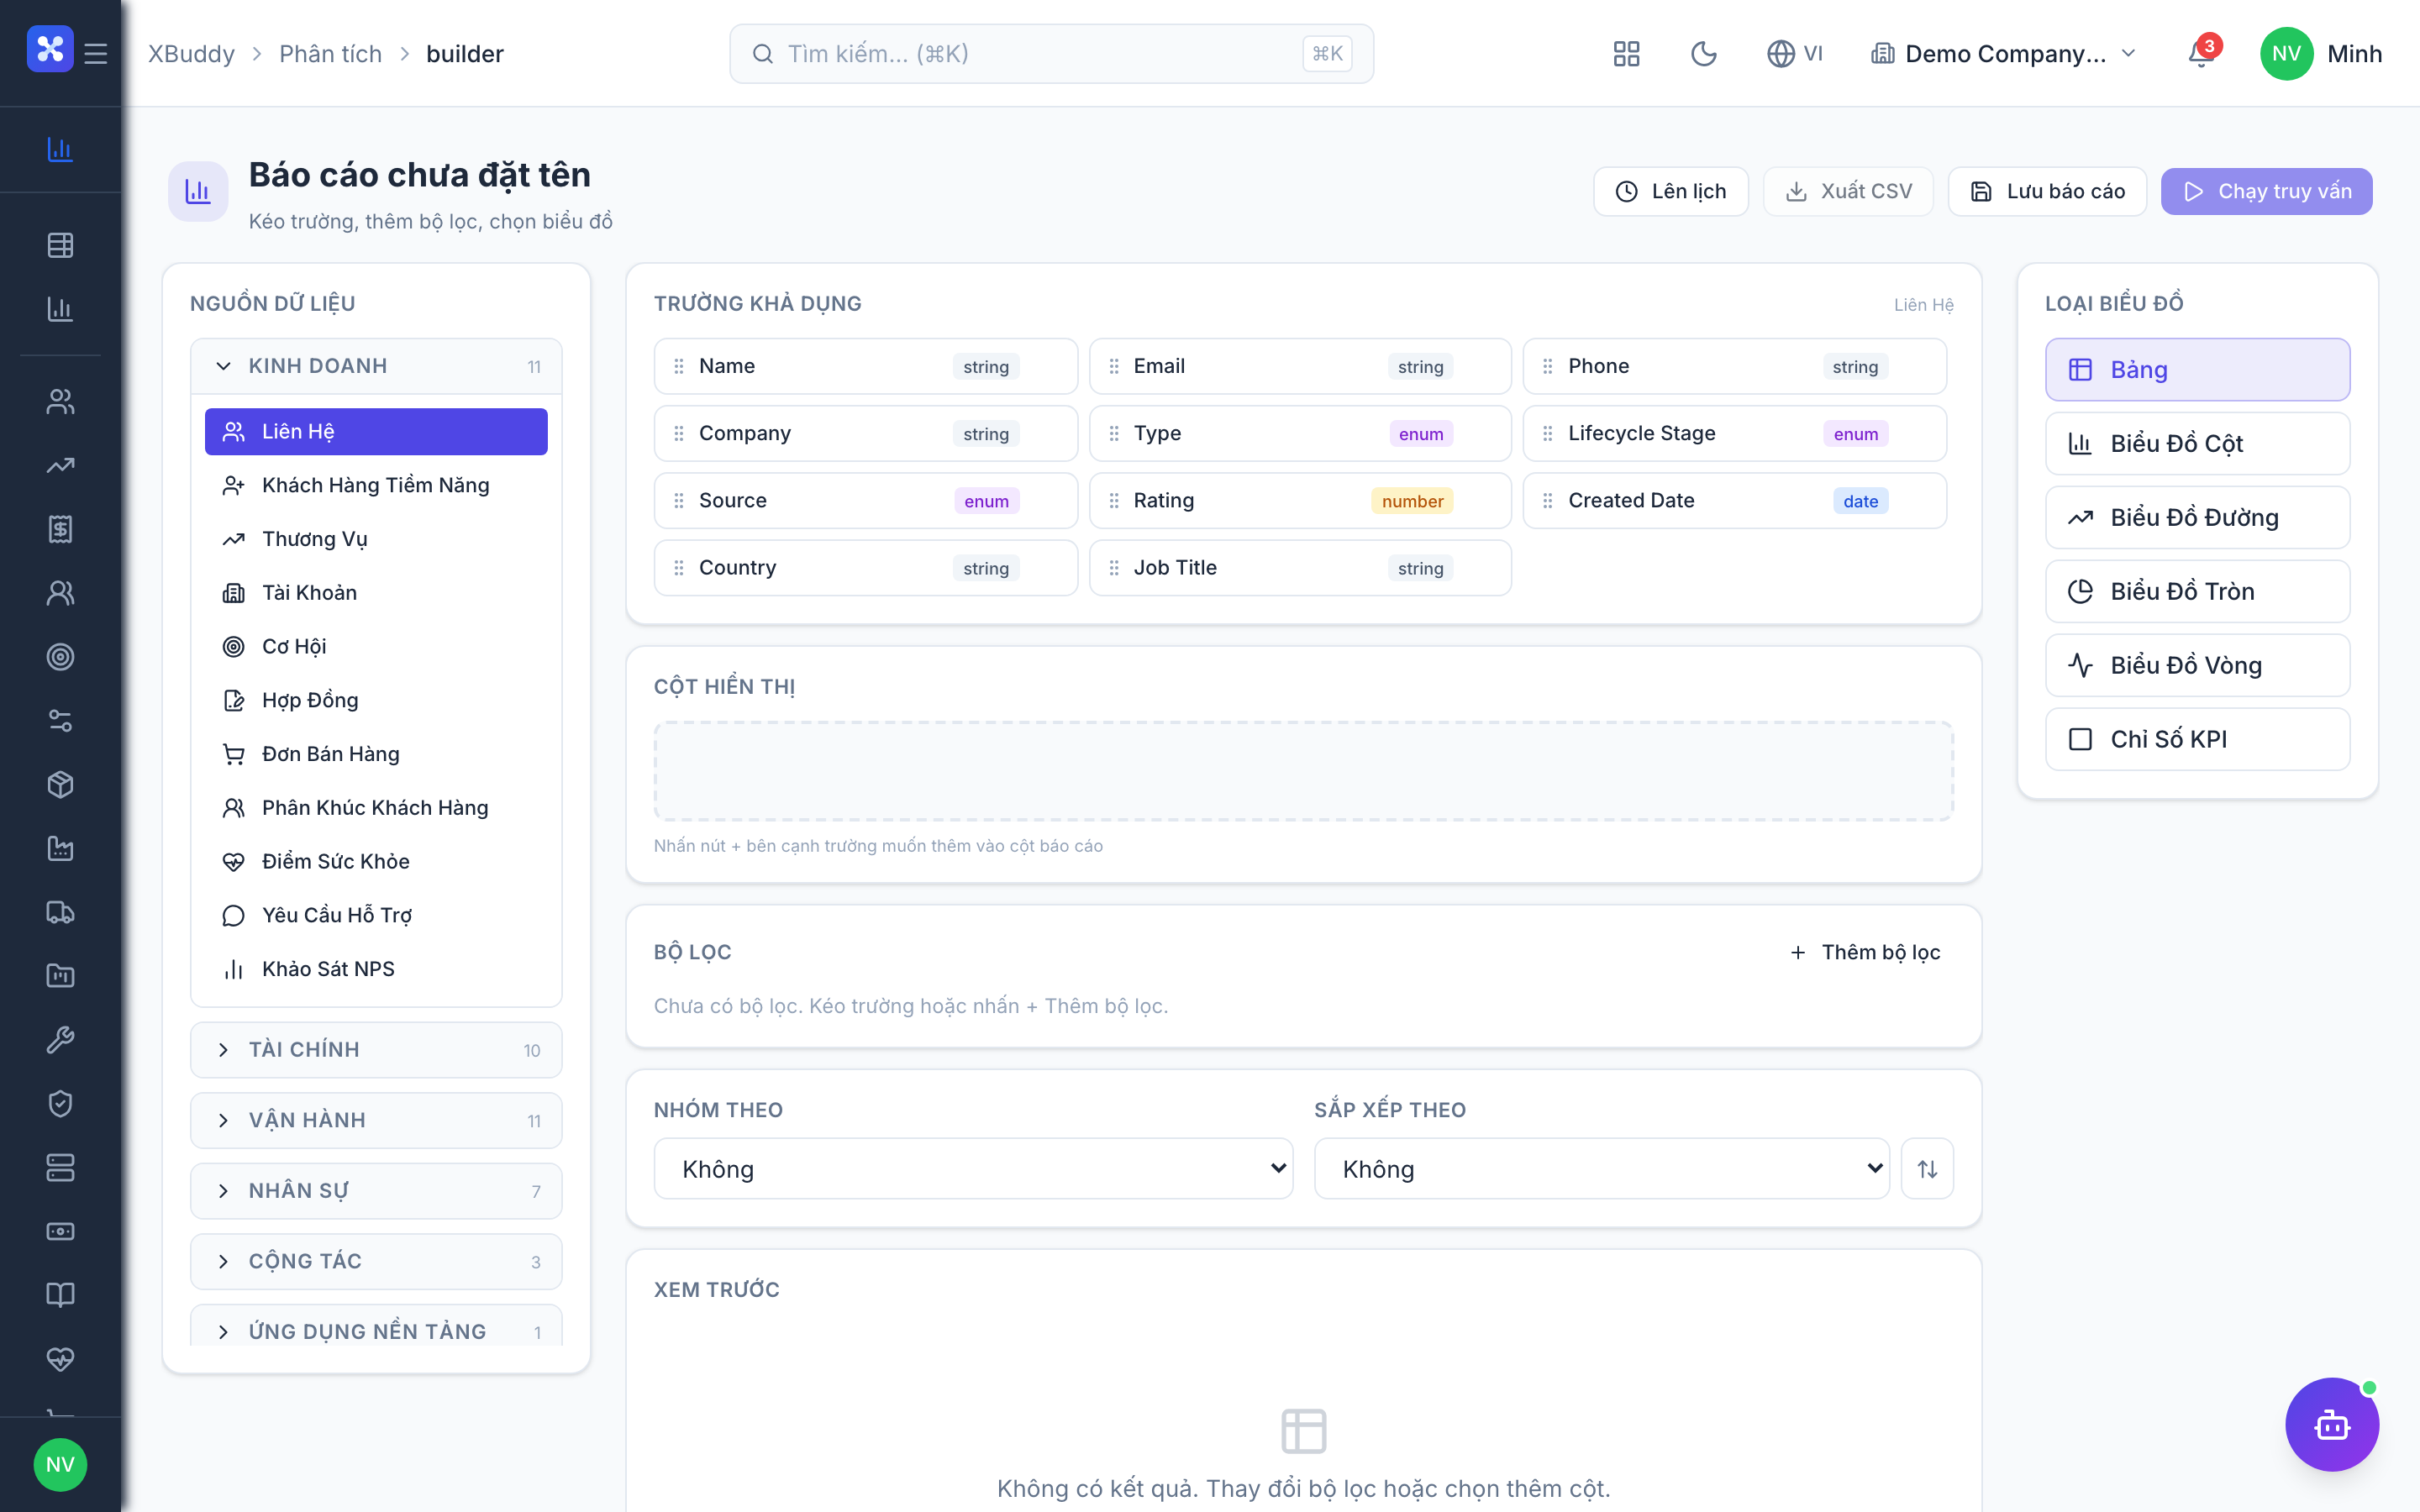
When no pre-built report fits, compose your own — no SQL required.
-
Go to /analytics/builder and click New Report.
-
Choose a data source (e.g. Invoices, Deals, Timesheets).
-
Drag dimensions (grouping fields like Month, Owner, Category) and measures (Sum, Count, Avg) into the layout.
-
Add filters, pick a visualization (table, bar, line), then Save — it now appears under Reports for reuse.
Scheduling report delivery
Automate recurring reports so stakeholders get them without logging in.
-
Open a saved report, then go to /analytics/scheduled (or click Schedule on the report).
-
Set the cadence (daily, weekly, monthly) and delivery time.
-
Add recipients (users or email addresses) and choose the format (CSV attachment or inline summary).
-
Save — the report is generated with its saved filters and emailed on schedule.
Exporting to CSV
Get any report out of XBuddy for spreadsheets or external tools.
-
Apply your filters on any domain report or saved report.
-
Click Export CSV in the report header.
-
The download reflects exactly the current filtered rows, including the totals footer.
-
Open in your spreadsheet tool; column headers match the on-screen table.
Full feature reference
| Nav item | Path | Description |
|---|---|---|
| Reports Hub | /analytics | Central catalog of every report across all modules; browse and search reports by domain. |
| CRM | /analytics/crm | Lead, contact, and account reports — funnel, source, conversion. |
| Sales | /analytics/sales | Pipeline, win rate, quota, and sales-by-owner/product reports. |
| Finance | /analytics/finance | AR/AP aging, revenue, cash flow, and P&L-style listing reports. |
| HR | /analytics/hr | Headcount, turnover, leave, and attendance reports. |
| Performance | /analytics/performance | Review-cycle, rating-distribution, and KPI-attainment reports. |
| Operations | /analytics/operations | Cross-operations throughput and utilization reports. |
| Inventory | /analytics/inventory | Stock value, movement, aging, and reorder reports. |
| Manufacturing | /analytics/manufacturing | Work-order, BOM consumption, and yield reports. |
| Logistics | /analytics/logistics | Shipment, delivery, and carrier-performance reports. |
| Field Service | /analytics/field-service | Job completion, SLA, and technician-utilization reports. |
| Quality | /analytics/quality | NCR trend, inspection pass rate, and defect-Pareto reports. |
| Assets | /analytics/assets | Asset register, depreciation, and maintenance reports. |
| Payroll | /analytics/payroll | Payroll cost, tax/BHXH, and PIT filing reports. |
| LMS | /analytics/lms | Course completion, compliance, and learner-progress reports. |
| Customer Success | /analytics/customer-success | Health-score, churn-risk, and renewal reports. |
| Procurement | /analytics/procurement | Spend-by-vendor, PO cycle-time, and three-way-match reports. |
| F&B | /analytics/fnb | Menu-mix, table-turn, and food-cost reports. |
| Projects | /analytics/projects | Project status, budget vs. actual, and task-throughput reports. |
| Service Management | /analytics/service-management | Ticket volume, resolution time, and CSAT reports. |
| Time Tracking | /analytics/time-tracking | Billable vs. non-billable hours and utilization reports. |
| Analytics Builder | /analytics/builder | Drag-and-drop custom report builder (source, dimensions, measures, filters, visualization). |
| Reports | /analytics/reports | Library of your saved and shared custom reports. |
| Scheduled | /analytics/scheduled | Manage recurring report deliveries — cadence, recipients, format. |
| AI Usage | /analytics/ai-usage | Track AI/agent token consumption and cost by agent and period. |
| Settings | /analytics/settings | Configure default filters, export options, and report-access rules. |
Integration points
| Module | How Analytics connects |
|---|---|
| All modules | Each domain report reads directly from its module’s data with row-level scope applied |
| Dashboard | Shares metric definitions so numbers reconcile between live widgets and reports |
| Communications | Scheduled reports are delivered via the email channel |
| Permissions / Data Scope | Reports respect own/team/all data scope so users only see rows they may access |
| AI Agents | AI Usage aggregates agent token cost; agents can attach generated insights |
Report rows honor your data scope. A sales rep on “own” scope sees only their deals in /analytics/sales; a director on “all” sees the whole company. Exports carry the same scope.
Related AI agents
| Agent | What it does here |
|---|---|
| Executive Briefing | Turns the period’s cross-domain reports into a narrative executive summary. |
| FP&A Analyst | Runs financial-planning analysis — cash-flow, budget-vs-actual, and variance insights surfaced in Finance reports. |
Common workflows
-
Monthly finance close pack
- Open /analytics/finance, set date range to last month.
- Review AR aging, revenue, and expense reports; export each to CSV.
- Build a combined custom summary in /analytics/builder if needed.
- Schedule it to the leadership team via /analytics/scheduled.
-
Custom sales-by-region report
- /analytics/builder → New Report → source Deals.
- Dimensions: Region, Owner; Measure: Sum of Value; filter Stage = Won.
- Choose a bar chart, Save; it lands under /analytics/reports.
- Schedule weekly delivery to the sales director.
-
Auditing AI spend
- Open /analytics/ai-usage and set the period to this month.
- Sort by token cost to find the most expensive agents.
- Adjust agent schedules or scope in the Automation app.
- Export the usage report for the finance record.
FAQ
Q: What’s the difference between Analytics and the Dashboard? The Dashboard is a live, single-page executive snapshot. Analytics is the full reporting suite — filterable domain reports, a custom builder, CSV export, and scheduled delivery. They share metric definitions so numbers agree.
Q: Do I need SQL to build a custom report? No. Analytics Builder is drag-and-drop — pick a source, drag dimensions and measures, add filters, and choose a chart type.
Q: Can I email a report automatically? Yes. Save the report, then create a schedule in /analytics/scheduled with a cadence and recipients. It’s generated with its saved filters and delivered by email.
Q: Will other users see the same numbers I do? Reports apply data scope. Someone on “own” or “team” scope sees fewer rows than someone on “all”. Totals and exports reflect each viewer’s scope.
Q: How do I export just the filtered rows, not everything? Apply your filters first, then click Export CSV — the download matches exactly what’s on screen, including the totals footer.
Q: Where do saved custom reports live? Under /analytics/reports. From there you can rerun, edit, share, or schedule them.